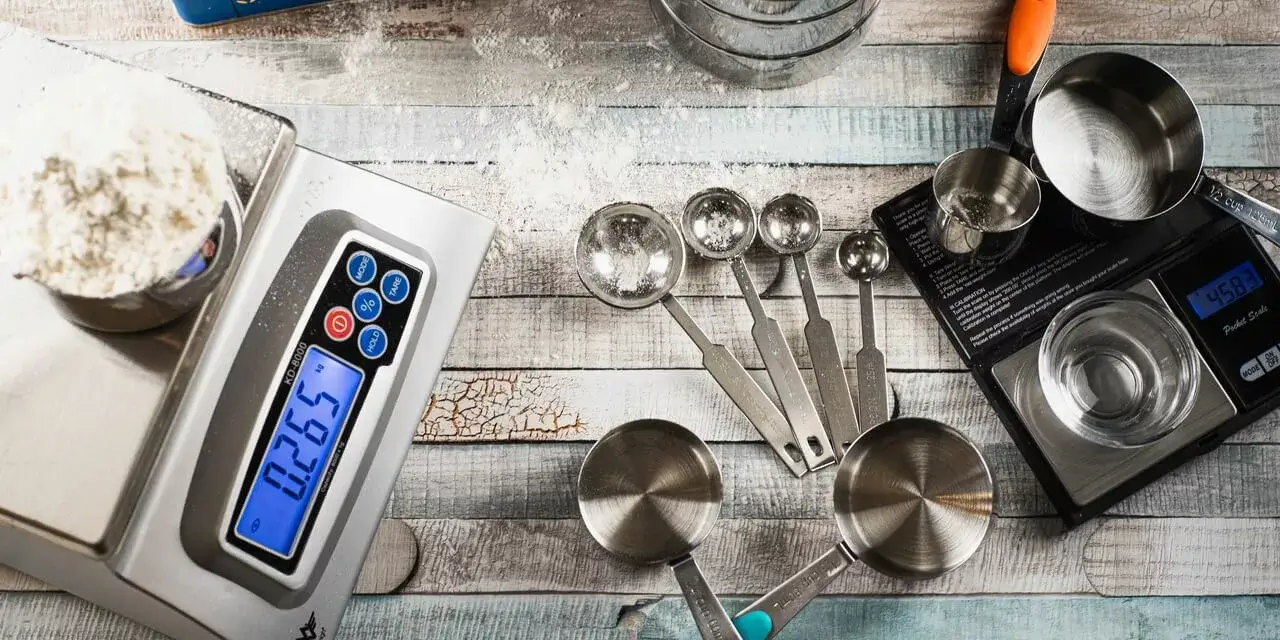
As someone who loves to bake, one of the biggest challenges I’ve faced in the kitchen is figuring out how to accurately measure ingredients. Different recipes call for different measurement units, and it can be difficult to keep track of all the different conversions. But fear not! In this article, I’ll be providing you with a comprehensive conversion chart for baking ingredients that will make your life so much easier.
First, let’s talk about the different measurement units you’ll come across in baking. Some recipes use cups, others use tablespoons or teaspoons. And to make things even more complicated, there are differences between US cups and UK cups. But don’t worry, we’ll cover all of this and more.
Why Use Grams?
By searching on the internet for how much grams a cup of all-purpose flour should be, you might come across different values ranging from 100 g to 150 g. That’s because there are various factors that can affect the weight of a cup of flour, such as the type of flour, how it’s packed, and even the humidity in the air.
That’s why all recipes on Delight Baking are always measured in grams. It’s the most accurate way to provide recipes that lead to consistent baking results. Therefore, the baking conversion charts we provide can only give you a rough idea of the conversions, as they are based on averages.
Conversion Chart For Baking Ingredients
Without further ado, let’s dive into the conversion chart. Here are the most common baking ingredients and their equivalents in cups, tablespoons, teaspoons, and grams.
Note: All measurements are approximate and have been rounded up or down to one decimal place.
Cups, Tablespoons And Teaspoons To Grams
| Ingredient | Cup | Tablespoon | Teaspoon |
|---|---|---|---|
| All-purpose flour | 125 g | 7.8 g | 2.6 g |
| Whole wheat flour | 120 g | 7.5 g | 2.5 g |
| White sugar | 200 g | 12.5 g | 4.2 g |
| Brown sugar | 217 g | 13.5 g | 4.5 g |
| Powdered sugar | 115 g | 7.2 g | 2.4 g |
| Salt | 288 g | 18 g | 6 g |
| Baking powder | 230 g | 14.4 g | 4.8 g |
| Baking soda | 230 g | 14.4 g | 4.8 g |
| Corn starch | 120 g | 7.5 g | 2.5 g |
| Cocoa powder | 125 g | 7.8 g | 2.6 g |
| Instant dry yeast | 150 g | 9.3 g | 3.1 g |
| Fresh yeast | 150 g | 9.3 g | 3.1 g |
| Water | 236 g | 14.7 g | 4.9 g |
| Milk | 245 g | 15.3 g | 5.1 g |
| Buttermilk | 245 g | 15.3 g | 5.1 g |
| Sour cream | 245 g | 15.3 g | 5.1 g |
| Butter | 227 g | 14.1 g | 4.7 g |
| Honey | 340 g | 21.3 g | 7.1 g |
| Vanilla extract | 208 g | 12.9 g | 4.3 g |
| Canola oil | 215 g | 13.5 g | 4.5 g |
| Sunflower oil | 215 g | 13.5 g | 4.5 g |
| Olive oil | 213 g | 13.2 g | 4.4 g |
Cups To Grams Conversion Chart
| Ingredient | 1 Cup | 1/2 Cup | 1/3 Cup | 1/4 Cup |
|---|---|---|---|---|
| All-purpose flour | 125 g | 62.5 g | 41.7 g | 31.3 g |
| Whole wheat flour | 120 g | 60 g | 40 g | 30 g |
| White sugar | 200 g | 100 g | 66.7 g | 50 g |
| Brown sugar | 217 g | 108.5 g | 72.3 g | 54.3 g |
| Powdered sugar | 115 g | 57.5 g | 38.3 g | 28.8 g |
| Salt | 288 g | 144 g | 96 g | 72 g |
| Baking powder | 230 g | 115 g | 76.7 g | 57.5 g |
| Baking soda | 230 g | 115 g | 76.7 g | 57.5 g |
| Corn starch | 120 g | 60 g | 40 g | 30 g |
| Cocoa powder | 125 g | 62.5 g | 41.7 g | 31.3 g |
| Instant dry yeast | 150 g | 75 g | 50 g | 37.5 g |
| Fresh yeast | 150 g | 75 g | 50 g | 37.5 g |
| Water | 236 g | 118 g | 78.7 g | 59 g |
| Milk | 245 g | 122.5 g | 81.7 g | 61.3 g |
| Buttermilk | 245 g | 122.5 g | 81.7 g | 61.3 g |
| Sour cream | 245 g | 122.5 g | 81.7 g | 61.3 g |
| Butter | 227 g | 113.5 g | 75.7 g | 56.8 g |
| Honey | 340 g | 170 g | 113.3 g | 85 g |
| Vanilla extract | 208 g | 104 g | 69.3 g | 52 g |
| Canola oil | 215 g | 107.5 g | 71.7 g | 53.8 g |
| Sunflower oil | 215 g | 107.5 g | 71.7 g | 53.8 g |
| Olive oil | 213 g | 106.5 g | 71 g | 53.3 g |
Tablespoons To Grams Conversion Chart
| Ingredient | 1 Tablespoon | 1/2 Tablespoon | 1/3 Tablespoon | 1/4 Tablespoon |
|---|---|---|---|---|
| All-purpose flour | 7.8 g | 3.9 g | 2.6 g | 2 g |
| Whole wheat flour | 7.5 g | 3.8 g | 2.5 g | 1.9 g |
| White sugar | 12.5 g | 6.3 g | 4.2 g | 3.1 g |
| Brown sugar | 13.5 g | 6.8 g | 4.5 g | 3.4 g |
| Powdered sugar | 7.2 g | 3.6 g | 2.4 g | 1.8 g |
| Salt | 18 g | 9 g | 6 g | 4.5 g |
| Baking powder | 14.4 g | 7.2 g | 4.8 g | 3.6 g |
| Baking soda | 14.4 g | 7.2 g | 4.8 g | 3.6 g |
| Corn starch | 7.5 g | 3.8 g | 2.5 g | 1.9 g |
| Cocoa powder | 7.8 g | 3.9 g | 2.6 g | 2 g |
| Instant dry yeast | 9.3 g | 4.7 g | 3.1 g | 2.3 g |
| Fresh yeast | 9.3 g | 4.7 g | 3.1 g | 2.3 g |
| Water | 14.7 g | 7.4 g | 4.9 g | 3.7 g |
| Milk | 15.3 g | 7.7 g | 5.1 g | 3.8 g |
| Buttermilk | 15.3 g | 7.7 g | 5.1 g | 3.8 g |
| Sour cream | 15.3 g | 7.7 g | 5.1 g | 3.8 g |
| Butter | 14.1 g | 7.1 g | 4.7 g | 3.5 g |
| Honey | 21.3 g | 10.7 g | 7.1 g | 5.3 g |
| Vanilla extract | 12.9 g | 6.5 g | 4.3 g | 3.2 g |
| Canola oil | 13.5 g | 6.8 g | 4.5 g | 3.4 g |
| Sunflower oil | 13.5 g | 6.8 g | 4.5 g | 3.4 g |
| Olive oil | 13.2 g | 6.6 g | 4.4 g | 3.3 g |
Teaspoons To Grams Conversion Chart
| Ingredient | 1 Teaspoon | 1/2 Teaspoon | 1/3 Teaspoon | 1/4 Teaspoon |
|---|---|---|---|---|
| All-purpose flour | 2.6 g | 1.3 g | 0.9 g | 0.7 g |
| Whole wheat flour | 2.5 g | 1.3 g | 0.8 g | 0.6 g |
| White sugar | 4.2 g | 2.1 g | 1.4 g | 1.1 g |
| Brown sugar | 4.5 g | 2.3 g | 1.5 g | 1.1 g |
| Powdered sugar | 2.4 g | 1.2 g | 0.8 g | 0.6 g |
| Salt | 6.0 g | 3.0 g | 2.0 g | 1.5 g |
| Baking powder | 4.8 g | 2.4 g | 1.6 g | 1.2 g |
| Baking soda | 4.8 g | 2.4 g | 1.6 g | 1.2 g |
| Corn starch | 2.5 g | 1.3 g | 0.8 g | 0.6 g |
| Cocoa powder | 2.6 g | 1.3 g | 0.9 g | 0.7 g |
| Instant dry yeast | 3.1 g | 1.6 g | 1.0 g | 0.8 g |
| Fresh yeast | 3.1 g | 1.6 g | 1.0 g | 0.8 g |
| Water | 4.9 g | 2.5 g | 1.6 g | 1.2 g |
| Milk | 5.1 g | 2.6 g | 1.7 g | 1.3 g |
| Buttermilk | 5.1 g | 2.6 g | 1.7 g | 1.3 g |
| Sour cream | 5.1 g | 2.6 g | 1.7 g | 1.3 g |
| Butter | 4.7 g | 2.4 g | 1.6 g | 1.2 g |
| Honey | 7.1 g | 3.6 g | 2.4 g | 1.8 g |
| Vanilla extract | 4.3 g | 2.2 g | 1.4 g | 1.1 g |
| Canola oil | 4.5 g | 2.3 g | 1.5 g | 1.1 g |
| Sunflower oil | 4.5 g | 2.3 g | 1.5 g | 1.1 g |
| Olive oil | 4.4 g | 2.2 g | 1.5 g | 1.1 g |
We don’t guarantee 100% accuracy for the displayed data. It is a collection based on the following sources:
If you have suggestions for improvements or additional data we could add, don’t hesitate and write a comment or contact us directly.
As you can see, the conversion charts cover a range of ingredients, from flour and sugar to butter and milk. It also includes some common baking powders such as baking powder and baking soda.
Using the conversion chart is easy. Let’s say you have a recipe that calls for 1 cup of all-purpose flour, but you only have a tablespoon measurement. You can look up the conversion for 1 cup of all-purpose flour in the chart, which is 125 g. Then, you can divide that by 16 to get the conversion for 1 tablespoon, which is approximately 8 g.
Another helpful feature of the chart is the breakdown of measurements for 1/2, 1/3, and 1/4 cups, tablespoons, and teaspoons. This makes it even easier to calculate the exact amount of ingredients you need for your recipe.
Why Is It Important To Be Precise In Baking
Baking is a science, and precise measurements are crucial for achieving consistent results. Unlike cooking, where you can often add a pinch of this or a dash of that, baking requires exact measurements to ensure the right balance of ingredients.
For example, using too much flour can make your baked goods dry and tough, while too much sugar can cause them to spread too much and be overly sweet. On the other hand, using too little flour can result in a flat and dense product, while too little sugar can make your baked goods taste bland.
Being precise in your measurements can also help you troubleshoot baking problems. If your cookies spread too much, it could be because you added too much sugar or butter. If your cake is too dry, it could be because you used too much flour.
Frequently Asked Questions (FAQ)
What Is The Difference Between US Cups And UK Cups?
US cups and UK cups have slightly different measurements. 1 US cup is equal to 236.6 mL, while 1 UK cup is equal to 284 mL. It’s important to pay attention to which measurement unit a recipe uses, so you can convert it correctly.
Can I Use Measuring Spoons Instead of a Scale?
While a scale is the most accurate way to measure ingredients, measuring spoons can be a good substitute if you don’t have one. Just make sure to level off the ingredients with a knife to ensure accuracy.
Can I Use Liquid Measuring Cups for Dry Ingredients?
Liquid measuring cups and dry measuring cups are designed differently and should not be used interchangeably. Liquid measuring cups have a spout and are designed to be filled to the brim, while dry measuring cups are leveled off. Using the wrong type of measuring cup can result in inaccurate measurements.
What’s The Best Way To Measure Butter?
The easiest way to measure butter is to use the markings on the wrapper. Most butter wrappers have markings for tablespoons and cups. If you don’t have the wrapper, you can use a scale to weigh the butter, or use measuring spoons.
Can I Convert Metric Measurements to US Measurements?
Yes, you can convert metric measurements to US measurements using the conversion chart above. Just look up the metric measurement and convert it to the equivalent US measurement.
In conclusion, having a conversion chart for baking ingredients is an essential tool for any baker. It can help you accurately measure ingredients and achieve consistent results in your baked goods. So next time you’re in the kitchen, be sure to have this chart handy to make your baking experience even more enjoyable.


Please add measurements for cream of tartar too!